
Global climate systems are currently undergoing a period of intense recalibration. Systematic data confirms that May 2026 officially represents the second warmest May record since global monitoring began. According to the Copernicus Climate Change Service (C3S), the global average surface air temperature reached a calibrated 15.81°C. Consequently, this figure stands 0.55°C above the 1991-2020 average, trailing only the extreme peaks recorded in 2024. This thermal baseline suggests a strategic shift in atmospheric stability as the tropical Pacific prepares for a significant El Niño event.
Structural Volatility and the Warmest May Record
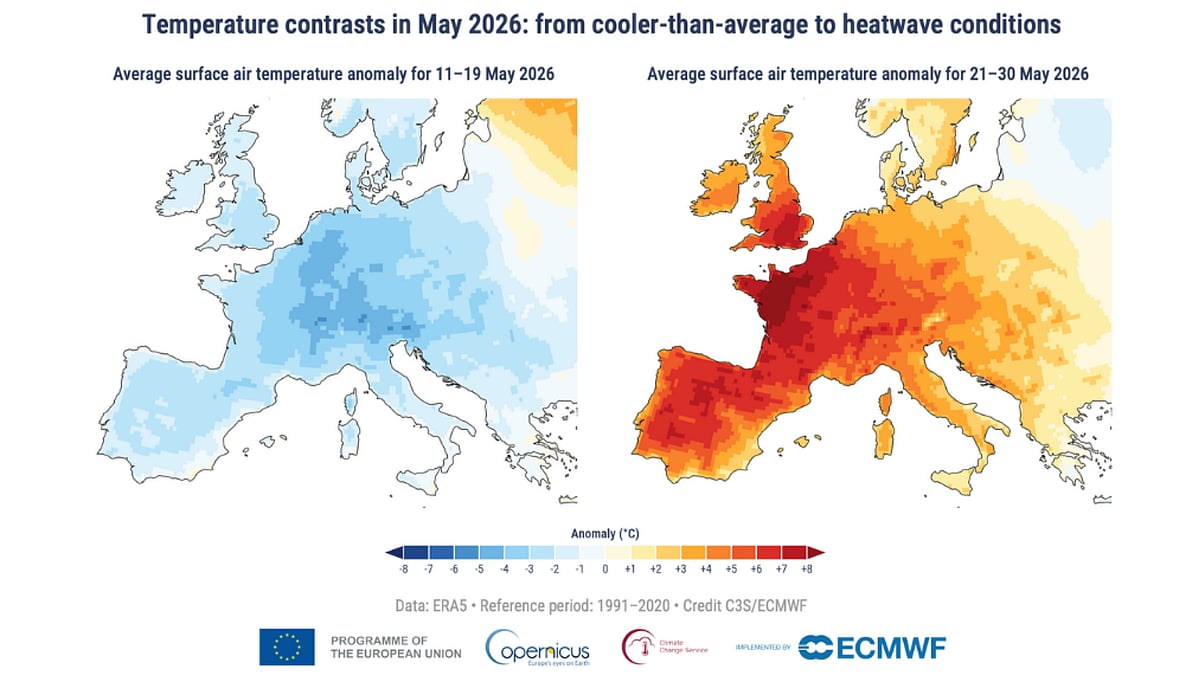
The report highlights a sharp transition in European weather patterns during the second half of the month. Initially, cooler conditions prevailed; however, western nations including France, the United Kingdom, and Portugal quickly faced intense early-season heatwaves. These regions recorded temperature anomalies that shattered previous historical benchmarks. Specifically, “feels-like” temperatures surged between 35°C and 40°C, creating a high-stress environment for regional infrastructure. Samantha Burgess, ECMWF Strategic Lead, noted that these climate extremes are rapidly becoming the new structural norm for the continent.

Global Precipitation and Cryospheric Precision
Hydrological patterns exhibited significant variance across the globe. While Spain and Italy faced drier-than-average conditions, catastrophic flooding impacted Türkiye and Bulgaria. Furthermore, major river basins such as the Danube and Vistula reported below-average flows, threatening inland navigation and water security. In contrast, southeastern North America and parts of Asia experienced above-average rainfall. Simultaneously, polar regions showed continued instability. Arctic sea ice extent remained 4% below average, while Antarctic ice reached the seventh-lowest extent for May, signaling a persistent decline in cryospheric health.
The Situation Room
The Translation
The transition toward an El Niño event serves as a catalyst for these thermal anomalies. When the tropical Pacific warms, it creates a domino effect across global jet streams. This data isn’t just about “hot weather”; it represents a fundamental shift in the earth’s energy balance. The second warmest May record is a precision indicator that the planetary cooling mechanisms are struggling to offset rising greenhouse gas concentrations.
The Socio-Economic Impact
For the Pakistani citizen, these global shifts translate into direct economic pressure. Rising global temperatures influence regional monsoon cycles, leading to unpredictable agricultural yields. Higher “feels-like” temperatures increase the baseline demand for energy, straining an already fragile national power grid. Students and professionals in urban centers like Karachi and Lahore must prepare for a future where extreme heat management is a prerequisite for productivity.
The Forward Path
This development represents a Momentum Shift toward extreme climate norms. We are no longer observing anomalies; we are witnessing the stabilization of a high-temperature era. To maintain national progress, Pakistan must accelerate its investment in heat-resilient infrastructure and precision agriculture. Data-driven adaptation is the only viable catalyst for long-term systemic stability.


